Slice and dice your data
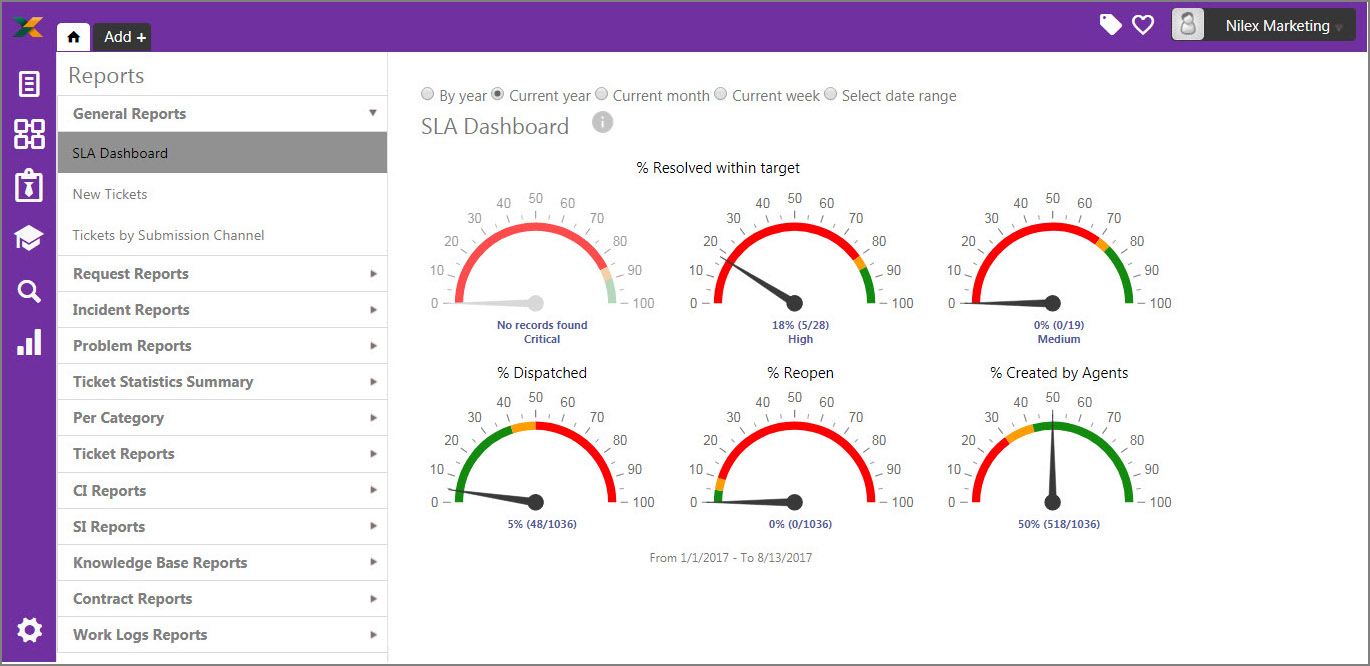
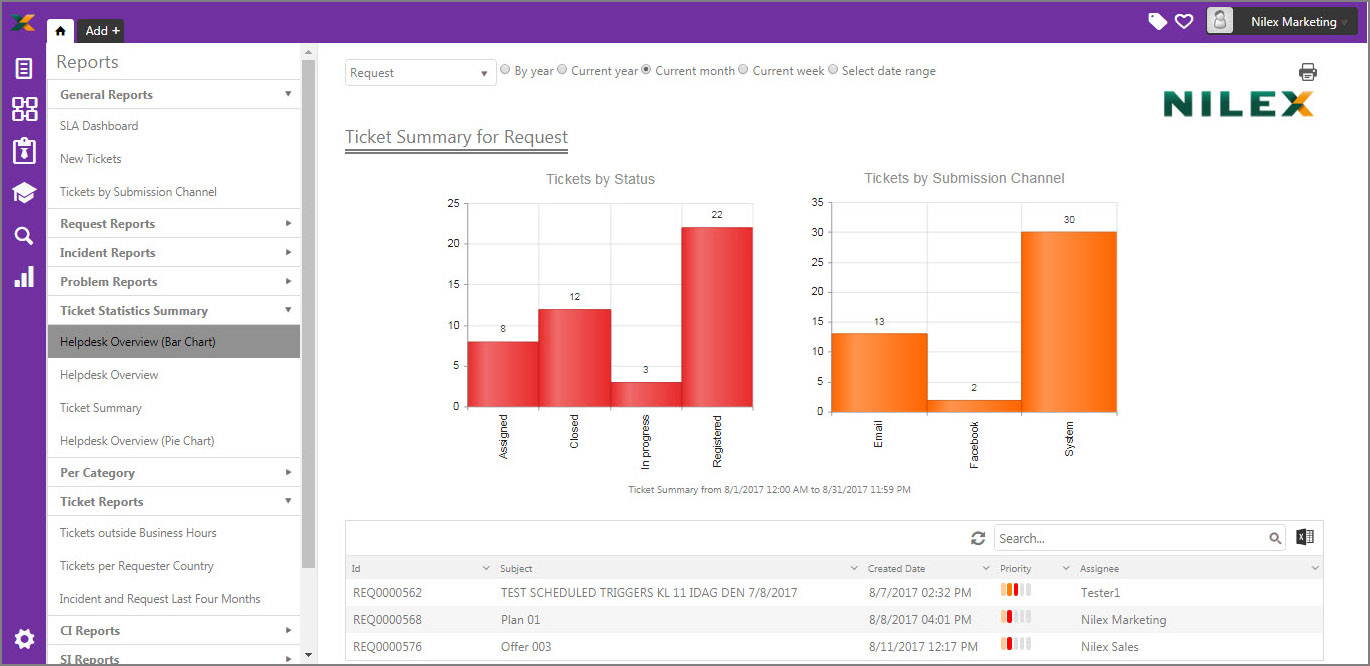
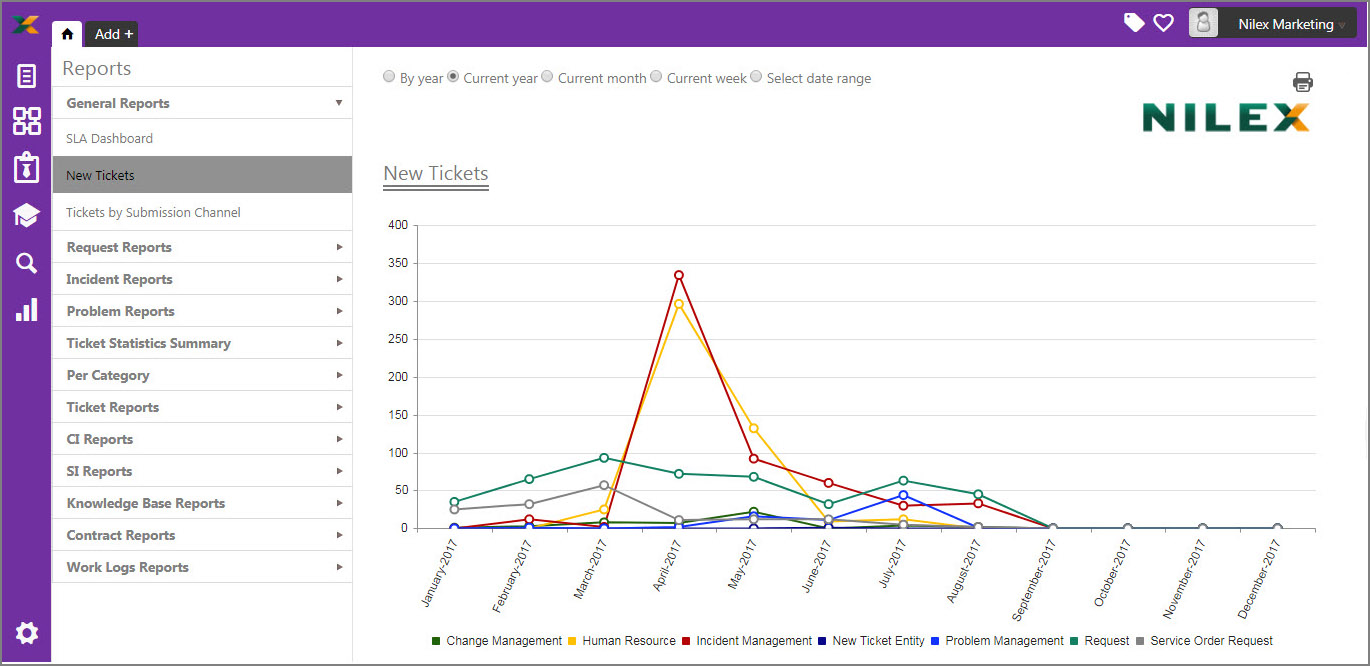
Get insight in which channel your tickets were created, how they were handled by your team, and areas where you can improve.
Report and track labeled cases at various states of a ticket cycle, understand inbound inquiries from your customers, and see at a glance what is happening in your support center all in one easy-to-read dashboard with point-and-click analysis.
Gain critical insight
Executives, managers, and end-users can all use easy-to-configure widgets to create tailored dashboards with information that addresses their specific metrics, such as service status, crossed thresholds and active requests.
Rather than viewing stagnant charts, users can perform actions directly from the dashboard.
Implemented options:
— Default reports
— Schedule reports
— Daily scheduled reports
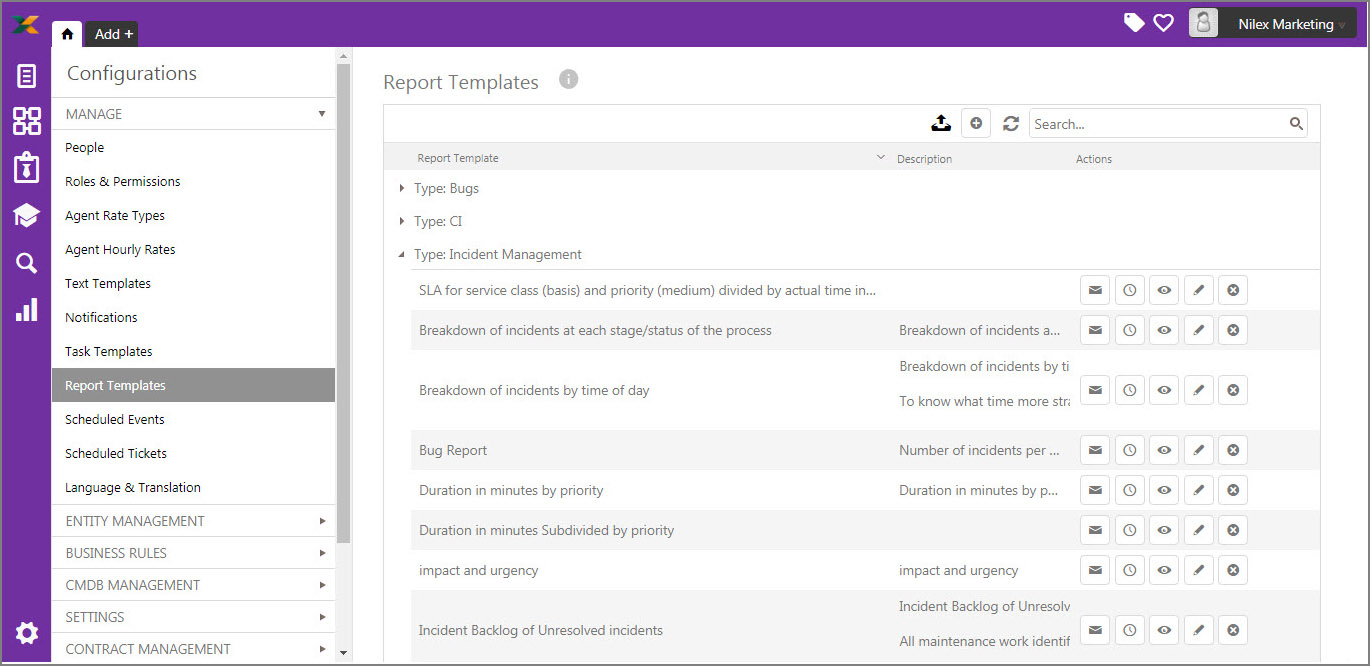
— Report template
— List reports
— Weekly scheduled reports
— Chart reports
— Pie reports
— Monthly scheduled reports
— Bar reports
— Line reports
— Once scheduled reports
— Report filters
— Preview report
— General reports


